Landscape Evaluation Measures for Inland Southwest Florida Feasibility Study: Wading Birds, Amphibians, Aquatic Fauna and Large Mammals
Authors
ZongBo Shang, Leonard G. Pearlstine , Michael Duever and Frank J. Mazzotti
Introduction
The objective of the Southwest Florida Feasibility Study (SWFFS) is to develop a comprehensive, ecologically sound regional plan for water resources in southwestern Florida. The University of Florida, Fort Lauderdale Research and Education Center is providing technical assistance with risk assessment models for impacts of hydrological and land use changes to the inland habitats of southwestern Florida.
Large Mammal Habitat Connectivity and Road Mortality
Black bear is used as an umbrella species to study habitat connectivity for large mammals in Southwest Florida. Black bear shares habitat with many of Florida's other native species. They can use many forest habitats, wetland and upland forests, as their primary home. By protecting the bears and their habitats, we can also protect the habitats of many other native species. Models for black bear habitat and landscape connectivity are based on previous work and cooperation with Dr. Tom Hoctor, University of Florida.
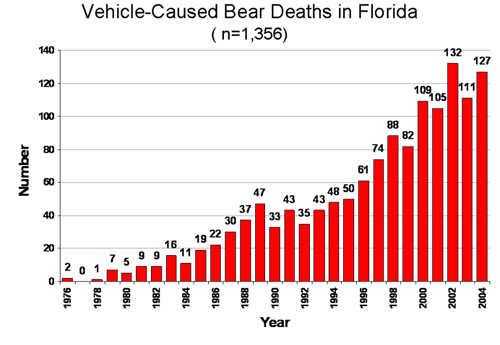
Figure 1. Vehicle-caused bear deaths in Florida (Florida Fish and Wildlife Conservation Commission).
Questions
- How well are habitat patches connected for large mammals?
- Where are the high potential risk area of large mammal road mortality?
Methods
Figure 2. An example shows the landscape connectivity.
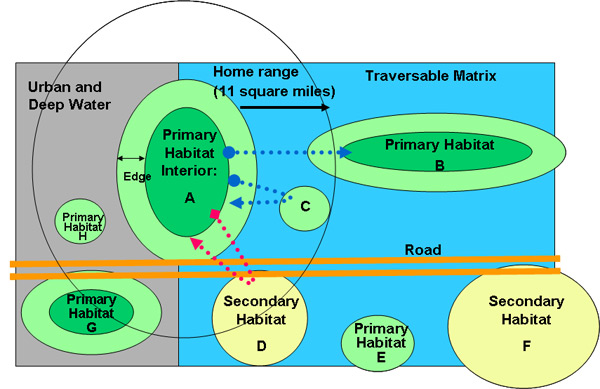
Landscape is classified as 4 types: i. Primary habitat (upland hardwood forests, wetland hardwood forests, etc.); ii. Secondary habitat (open land, Woodland pasture, cypress, etc.); iii. Traversable matrix (golf courses, parks, salt marsh etc.); iv. Urban and deep water.
For example, bears live in patch A. They can travel across the traversable matrix, and find food in patch B. Patch B in block size is large enough to support bear populations. They can travel to patch C and search for food. But the size is not large enough so bears can not use Patch C as their home. Bears can travel to patch D searching for food. There is a road between Patch A and D. Bears may be killed when they crossing the road. Patch E is beyond the dispersal distance. Similarly, Patch F is too far away. Patch G and H are blocked by urban and deep water, so bears can not get there.
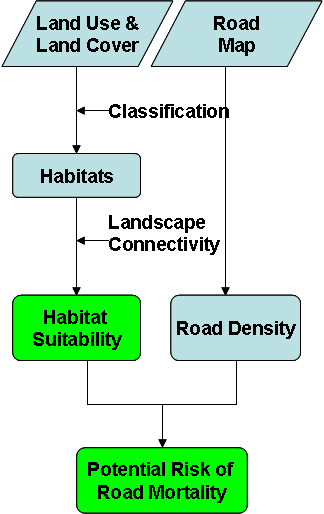
Figure 3. A flowchart shows the processes of modeling habitat suitability and potential risk of road mortality.
Results
Figure 4. Habitat suitability for Florida black bears.
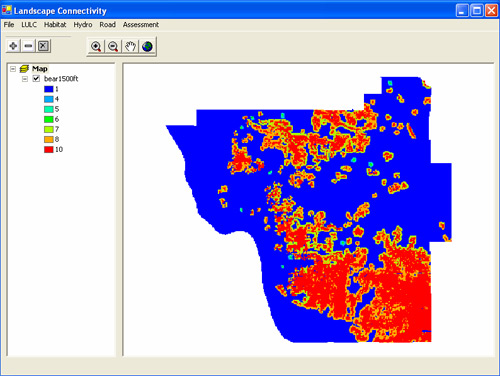
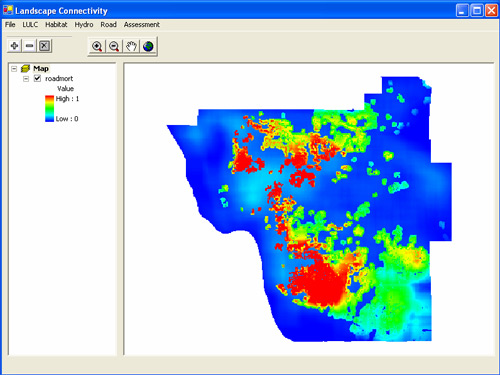
Figure 5. Potential risk of Florida black bear road mortality.
Legend of Habitat Suitability:
Within combined habitat patches containing 10, 000 acres or more primary and secondary habitats, primary habitat in block size >= 370 acres is ranked as 10; secondary habitat & primary habitat < 370 acres is ranked as 8; traversable matrix is ranked as 7.
Within combined habitat patches containing 5, 000 ~ 10, 000 acres primary and secondary habitats, primary habitat in block size >= 370 acres is ranked as 6; secondary habitat & primary habitat < 370 acres is ranked as 5; traversable matrix is ranked as 4.
All others are ranked as 1.
Amphibian Habitat Suitability
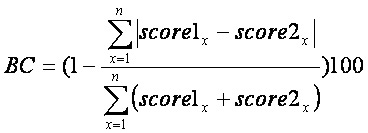
Habitat Suitability Index =
(Suitability score for Hydroperiod)
x (Suitability score for Land Cover)
x (Suitability score for Spatial patterns)
Example: Pig Frog (Rana grylio)
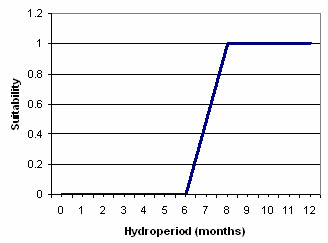
Hydroperiod and Suitability
Figure 6. Hydroperiod and pig frog (Rana grylio) habitat suitability.
| Land Cover | Suitability |
| Cypress Dome/Strand | 0.78 |
| Pineland (Hydric-Mesic) | 0.32 |
| Hardwood Hammock | 0.90 |
| Marsh | 1.00 |
| Dwarf Cypress Prairie | 0.90 |
Amphibian suitability models were developed in cooperation with Dr. Ken Rice, USGS, Dr. David Ceilley, Florida Gulf Coast University, and Dr. Hardin Waddle, University of Florida.
Figure 7: Left: Hydro period under scenario I, 1994
Right: Habitat suitability of pig frog under scenario I, 1994
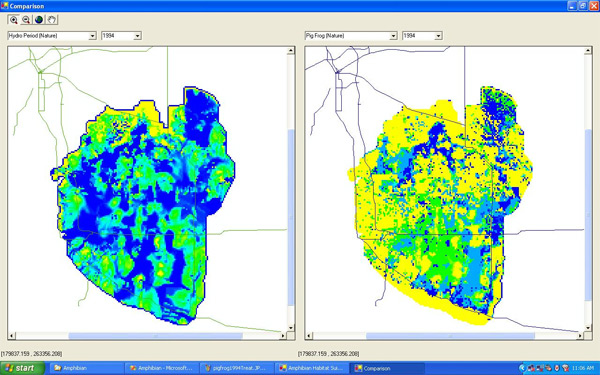
Figure 8: Left: Hydro period under scenario II, 1994
Right: Habitat suitability of pig frog under scenario II, 1994
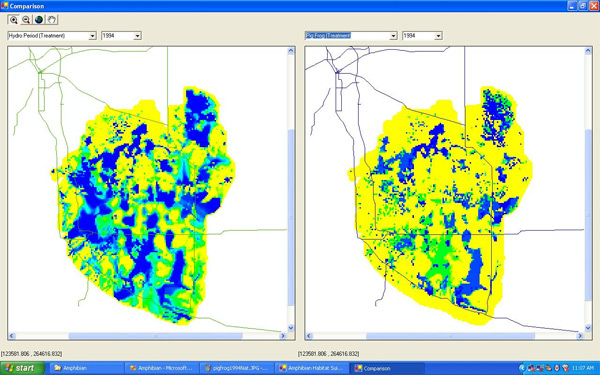
Figure 9: Bray-Curtis similarity between scenario I and II for 14 amphibian species.
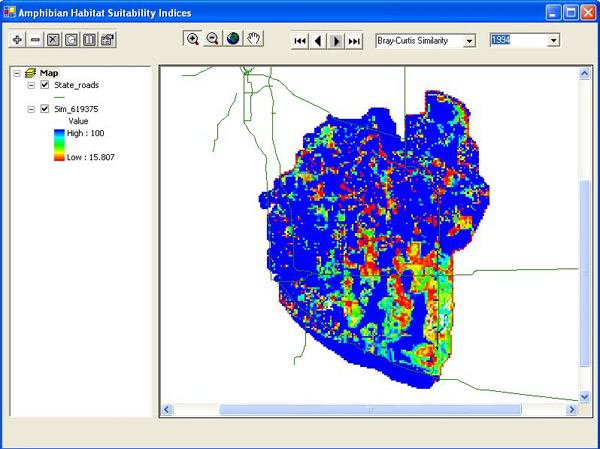
Habitat suitability of 14 amphibian species was simulated under two scenarios. Then, a Bray-Curtis similarity was calculated between two scenarios for 14 amphibian species, to examine the sensitivity of amphibian response to environment changes.
Habitat suitability was simulated for 14 amphibian species, including:
Cuban Treefrog (Osteopilus septentrionalis) *
Chorus Frog (Pseudacris nigrita)
Little Grass Frog (Pseudacris ocularis)
Pig Frog (Rana grylio)
Leopard Frog (Rana sphenocephala)
Barking Tree Frog (Hyla gratiosa)
Pinewoods Tree Frog (Hyla femoralis)
Cricket Frog (Acris gryllus)
Oak Toad (Bufo quercicus)
Southern Toad (Bufo terrestris)
Greenhouse Frog (Eleutherodactylus planirostris) *
Eastern Narrowmouth Toad (Gastrophryne carolinensis)
Green Treefrog (Hyla cinerea)
Squirrel Treefrog (Hyla squirella)
*exotic
Aquatic Fauna Habitat Suitability
Aquatic fauna suitability models were developed in cooperation with Dr. Willian Loftus, USGS, Dr. David Ceilley, Florida Gulf Coast University, and Dr. Joel Trexler, Florida International University.
Habitat Suitability Index =
(Suitability score for Hydroperiod)
x (Suitability score for Land Cover)
x (Suitability score for Additional Influences)
(Additional influences include Nutrients, Spatial pattern, Depth of flooding)
Figure 10: Hydroperiod and habitat suitability of 17 aquatic fauna species.
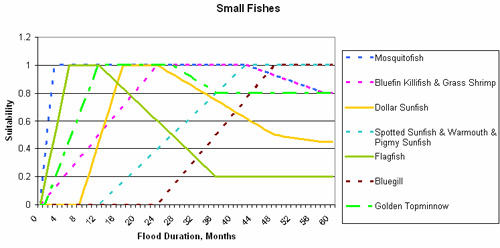
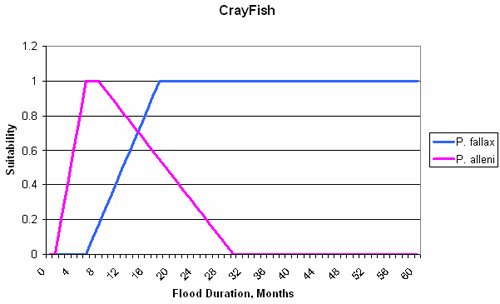
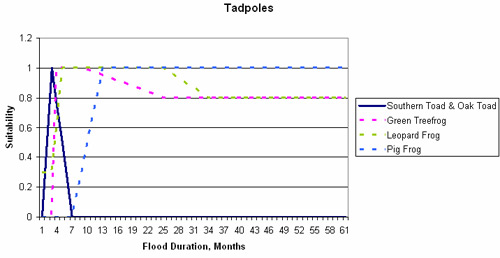
Figure 11: Left - Hydro period under scenario I, 1994. Right - Habitat suitability of mosquito-fish under scenario I, 1994.
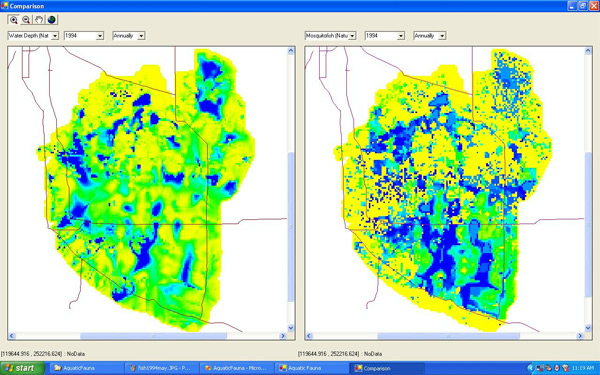
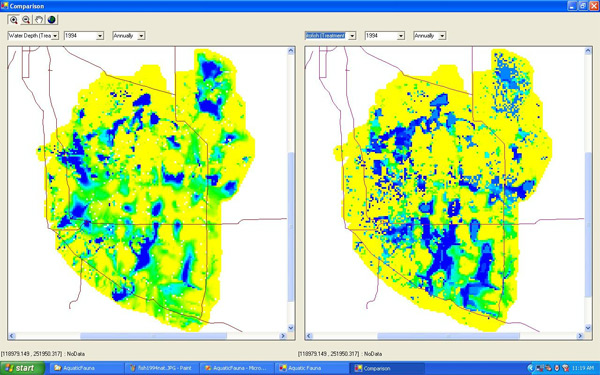
Figure 12: Left - Hydro period under scenario II, 1994. Right - Habitat suitability of mosquito-fish under scenario II, 1994.
Habitat suitability was simulated for 17 aquatic fauna species, including:
Grass Shrimp (Palaemonetes paludosus)
Green treefrog larvae (Hyla cinerea)
Pig Frog tadpoles (Rana grylio)
S. Leopard Frog larvae (Rana utricularia)
Oak Toad larvae (Bufo quercicus)
Cricket frog larvae (Acris gryllus dor.)
Everglades Crayfish (Procambaris Alleni)
Slough Crayfish (Procambaris Fallax)
Flagfish (Jordanella floridae)
Golden Topminnow (Fundulus chrysotus)
Warmouth (Lepomis gulosus)
Spotted Sunfish (Lepomis punctatus)
Bluegill (Lepomis macrochirus)
Mosquitofish (Gambucia holbrookii)
Bluefin Killifish (Lucania goodei)
Dollar Sunfish (Lepomis marginatus)
E. Pygmy Sunfish (Elassoma evergladei)
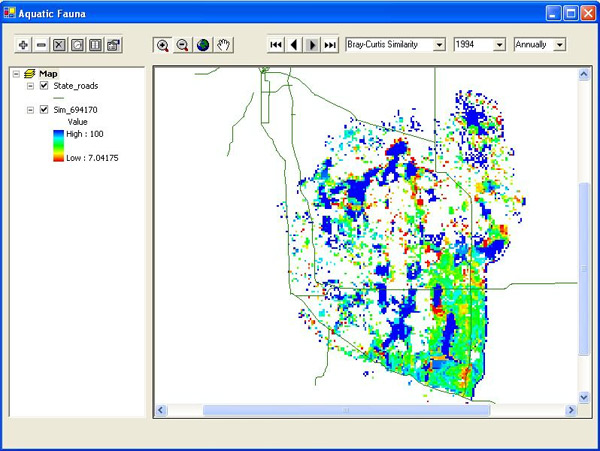
Habitat suitability of 17 aquatic fauna species was simulated under two scenarios. Then, a Bray-Curtis similarity was calculated between two scenarios for 14 amphibian species, to examine the sensitivity of aquatic fauna species response to environment changes.
Figure 13: Bray-Curtis similarity between scenario I and II for 17 aquatic fauna species.
Wading Bird Habitat Suitability
Wading bird suitability models for the White Ibis and the Wood Stork were developed in cooperation with Dr. Dale Gawlik, Florida Atlantic University.
Figure 14: A flowchart shows the processes of modeling habitat suitability of wading birds (wood stock and white ibis).
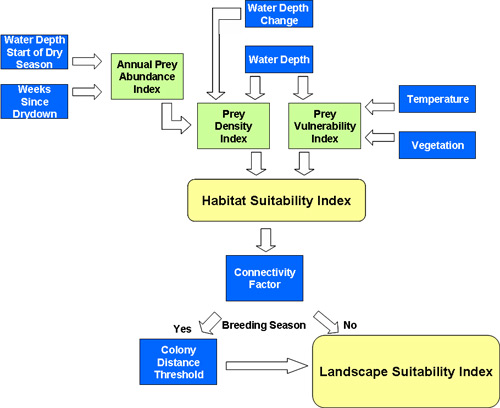
A model was developed to simulate the habitat suitability for wading birds (wood stock and white ibis) annually and monthly between 1991 and 1998.
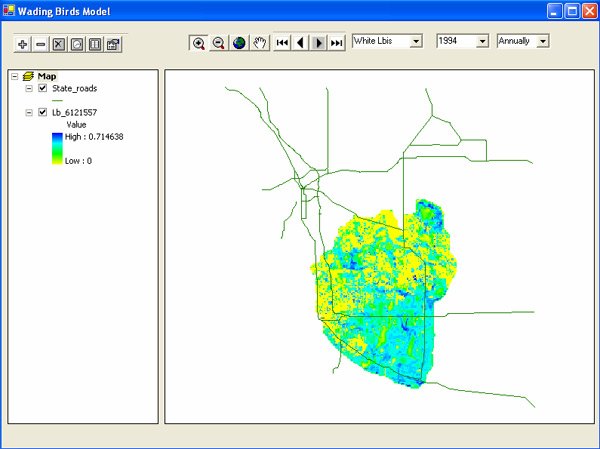
Figure 15: Habitat suitability of white ibis in 1994.
Citation
Shang, ZongBo, Leonard G. Pearlstine, Michael Duever and Frank J. Mazzotti. (2006, June). Landscape Evaluation Measures for Inland Southwest Florida Feasibility Study: Wading Birds, Amphibians, Aquatic Fauna and Large Mammals. Poster presented at the Greater Everglades Ecosystem Restoration Conference, Orlando, Florida.
More About This Project
Technical Assistance for an Ecological Evaluation of the Southwest Florida Feasibility Study


