User Interface to the Everglades Depth Estimation Network (EDEN)
Authors
Leonard Pearlstine, Darcy Thomas, and Frank Mazzotti
Introduction
Everglades Depth Estimation Network or 'EDEN' aims to assist the RECOVER MAP funded project entitled "South Florida Surface Water Hydrologic Network for Support of MAP Projects". EDEN captures real-time, telemetered water-level data in a single integrated network of existing and new water-level gages. EDEN provides continuous spatial hydrologic information such as water level, water depth, recession rates, time since last dry period, water-surface slope, and hydroperiod across the greater Everglades landscape. Presented on a 400-square- meter grid spacing, EDEN offers a consistent and documented dataset that can be used to guide large-scale field operations, to integrate hydrologic and ecological responses, and to support biological and ecological assessments that measure ecosystem responses to the Comprehensive Everglades Restoration Plan (CERP). Come to the EDEN booth to learn more about EDEN's operation.
EDENapps
The user interface for retrieval, display and analysis of EDEN products is called EDENapps. The target users are biology and ecology investigators examining tropic level response to hydrodynamic change in the Everglades. There are three different EDEN Grid tropic themes retrieved and loaded into the new map on the user's PC. These are water surface (or stage) grids, water depth grids, and days since dry down grids. The user accomplishes tasks via three tabs on the user interface. The first tab titled "Query Map" is for specifying an area of interest for a date range and performing communication with an FTP server. The second and third tabs, titled "Animation" and "Hydrograph" respectively, are for viewing the results of the returned data from the server and performing analyses.
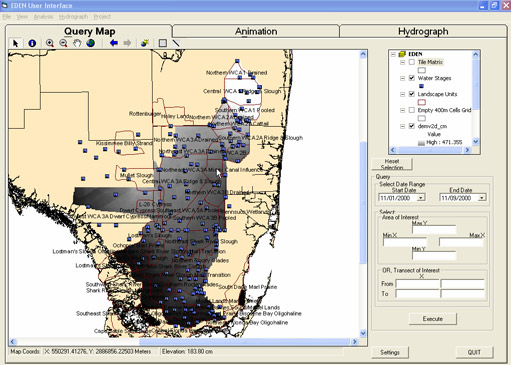
The Query Map Page
The user initiates the retrieval of data they are interested in by selecting an area of interest (AOI) and a date range. EDENapps will determine if the requested data needs to be downloaded from a remote server or if the data already exists on the local machine. Either way, once the data has been located the app will load it, in the form of ESRI GRID layers, into a map display for animation, analysis, and report creation. The user can select an AOI by either entering its corner coordinates in the query boxes on the right-hand side or by using the cursor to drag a rubberband box over the AOI. A starting and ending date are selected and the appropriate data is retrieved from the remote server.
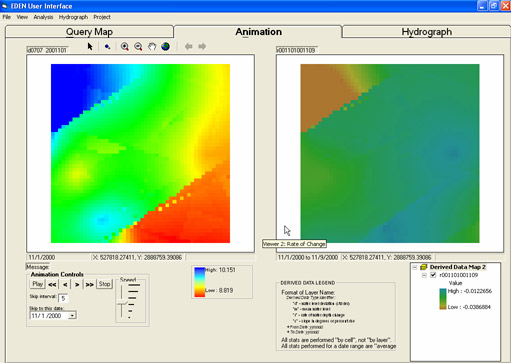
The Map Analysis Page
The selected spatial data are loaded into an animation and are available for further analyses. The animation allows the user to view all the selected dates of data together either as a movie or as individual layers of information. Pan and zoom tools allow navigation. Placing the cursor anywhere on the map gives the coordinate location.
Analyses which can be performed on the retrieved data includes:
- Deriving new data layers for a specified date range
- Producing a hydrograph for locations specified by the user
- Viewing statistics for these same specified locations
Derived data layers that can currently be generated are:
- Rate of Water Depth Change (recession or rise)
- Mean water level
- Water level deviation (standard deviation)
- Slope (expressed in degrees or percent rise)
The newly generated information layers are displayed in the second (right-hand) viewer. The side-by-side viewers allow for comparisons of the different spatial variables in the AOI.
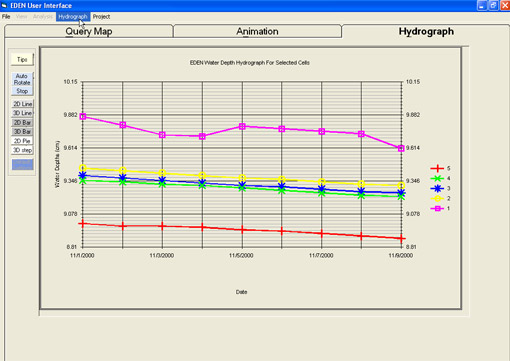
The Hydrograph Page
Cell values of water stage or water depth over a chosen time period. The cell values plotted are interactively selected by user on the map analysis page. The user can select from multiple graph types and print or save the plot.
Project Funding
RECOVER Monitoring and Assessment Plan and U.S.Geological Survey, Greater Everglades Priority Ecosystem Science, D.O.I.
Citation
Pearlstine, Leonard, Darcy Thomas, and Frank Mazzotti. (2006, June). User Interface to the Everglades Depth Estimation Network (EDEN). Poster presented at the Greater Everglades Ecosystem Restoration Conference, Orlando, Florida.


